
China Resources Land (SEHK:1109), What Is Behind The Fresh Attention?
China Resources Land (SEHK:1109) just released unaudited sales figures for August 2026, providing fresh data on contracted sales momentum and recurring income trends across its mainland China property portfolio.
For context, China Resources Land’s share price is HK$28.64, and the stock has slipped 19.05% on a 30 day share price return and 8.15% over 90 days, even though the year to date share price return is up 3.32% and the 5 year total shareholder return of 21.69% suggests longer term holders have seen a different picture compared with recent short term weakness.
Scan how China Resources Land compares with other big developers showing sales momentum and recurring income strength using our hand-picked list of solid balance sheet and fundamentals (198 results).
China Resources Land now trades well below both its analyst target and intrinsic value estimate after a sharp slide in recent weeks. Does that gap point to mispricing, or a fair reflection of today’s risks and cash flows?
Preferred P/E Multiple of 7.5x: Is It Justified For China Resources Land?
China Resources Land trades on a P/E of 7.5x, which looks low against peers and sector benchmarks at the current HK$28.64 share price.
The P/E ratio links what you pay today for each dollar of earnings that the business generates. For a developer and landlord like China Resources Land, this metric helps you compare how the market is valuing its earnings power relative to other Hong Kong real estate stocks.
Analyst data suggests the stock is trading at what is described as good value compared to peers and the wider Hong Kong Real Estate industry. The 7.5x P/E is also well below the peer average P/E of 15.4x, which points to a strong discount. In addition, it sits far under an estimated fair P/E of 13.8x, a level that the market could move towards if sentiment or earnings quality shift over time.
Against the Hong Kong Real Estate industry average P/E of 8.9x, China Resources Land comes in cheaper again, which underlines how heavily the current share price is being marked down versus sector norms.
Explore the SWS fair ratio for China Resources Land.
Result: Price-to-earnings of 7.5x (UNDERVALUED)
Still, weak recent share returns and a slight decline in annual revenue growth for China Resources Land raise questions about earnings quality and investor patience.
Find out about the key risks to this China Resources Land narrative.
Another View on China Resources Land’s Value
While the 7.5x P/E hints at a discount for China Resources Land, the SWS DCF model points to a very different picture. On that framework, the estimated future cash flow value is HK$70 per share, which frames the current HK$28.64 price as heavily undervalued. Which lens do you trust more when real money is on the line?
Our DCF approach spells out every assumption so you can judge the gap for yourself, not just the headline number. Look into how the SWS DCF model arrives at its fair value.
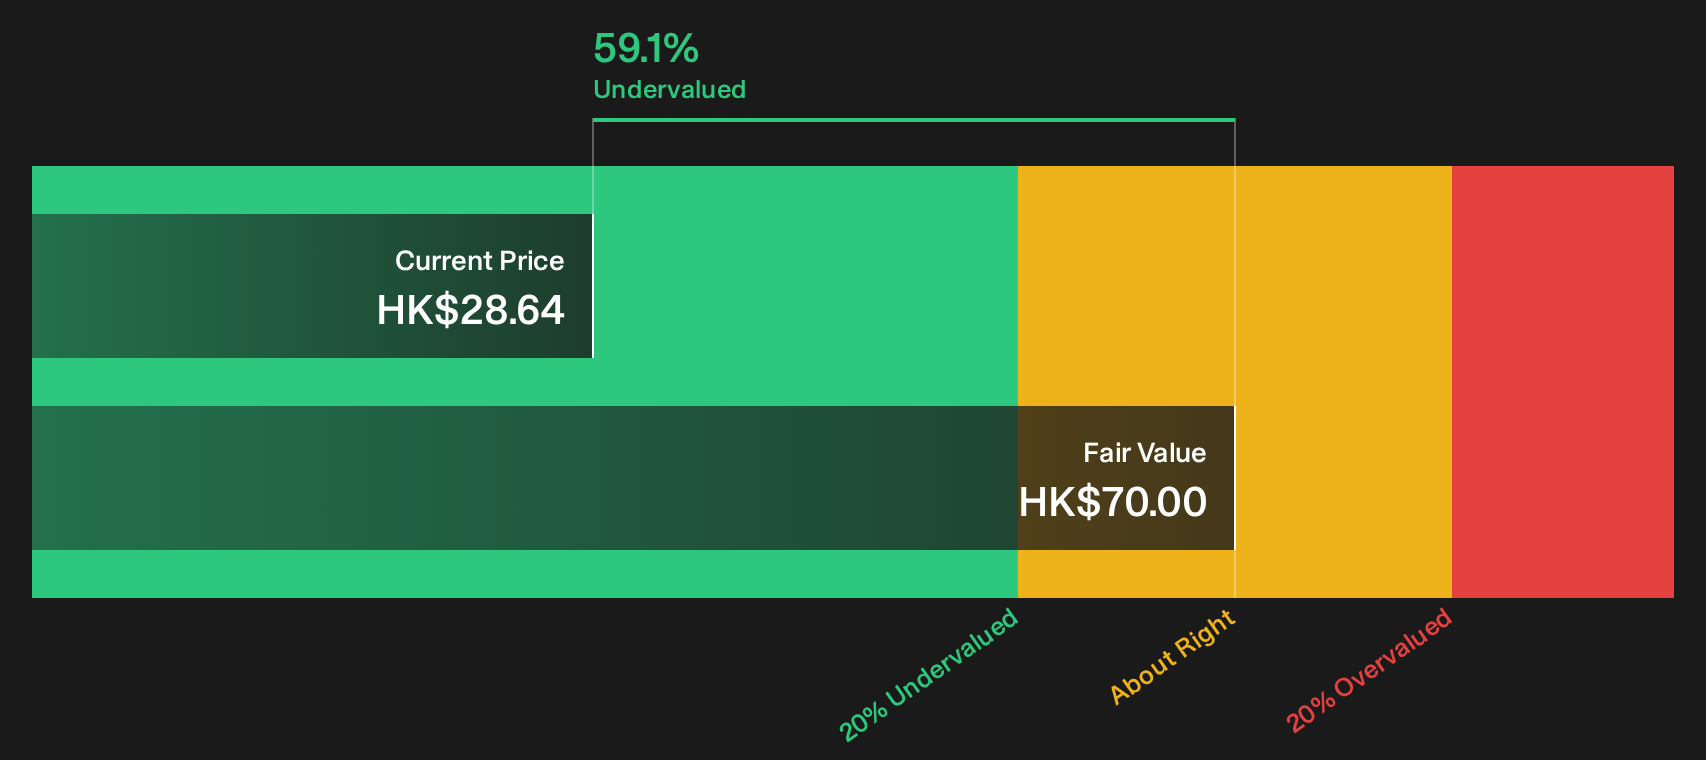
Simply Wall St performs a discounted cash flow (DCF) on every stock in the world every day (check out China Resources Land for example). We show the entire calculation in full. You can track the result in your watchlist or portfolio and be alerted when this changes, or use our stock screener to discover 179 high quality undervalued stocks. If you save a screener we even alert you when new companies match - so you never miss a potential opportunity.
Next Steps
Mixed signals around China Resources Land’s valuation and recent share performance can feel messy, so use the numbers as your guide and move quickly to stress test both sides of the story by reviewing the 5 key rewards and 2 important warning signs.
Looking for more investment ideas beyond China Resources Land?
If you stop with China Resources Land, you could miss other opportunities that better fit your goals, risk comfort, and preferred mix of income and growth potential.
- Target potential value opportunities by scanning companies that trade at a discount to fundamentals using our curated list of 179 high quality undervalued stocks.
- Strengthen your income stream by focusing on payouts with our hand-picked set of 159 dividend fortresses.
- Dial down risk in your portfolio by filtering for resilient balance sheets and steady fundamentals using the Simply Wall St 227 resilient stocks with low risk scores.
This article by Simply Wall St is general in nature. We provide commentary based on historical data and analyst forecasts only using an unbiased methodology and our articles are not intended to be financial advice. It does not constitute a recommendation to buy or sell any stock, and does not take account of your objectives, or your financial situation. We aim to bring you long-term focused analysis driven by fundamental data. Note that our analysis may not factor in the latest price-sensitive company announcements or qualitative material. Simply Wall St has no position in any stocks mentioned.
Have feedback on this article? Concerned about the content? Get in touch with us directly. Alternatively, email editorial-team@simplywallst.com
Contact Us
Contact Number :+852 3852 8500Webull Securities Limited is licensed with the Securities and Futures Commission of Hong Kong (CE No. BNG700) for carrying out Type 1 License for Dealing in Securities, Type 2 License for Dealing in Futures Contracts and Type 4 License for Advising on Securities.

English